Yield Management
November 9, 2021
The journey through a post-GFC (Global Financial Crisis) world has been along a road paved with free money. The things we've seen along the way are part reality, part illusion. Artificially low interest rates and the gamification of capital markets mean every investor is 'above average.'
Analyst:
"This investing thing is easy. Just look at my crypto account."
CIO:
"Markets, like life, are cyclical. The pendulum swings between extremes. Anyone who started trading or investing in the last decade has yet to experience a real business cycle. Or credit cycle. Or inflation cycle. What we've experienced over the last few years is not real. Even the 'Great Lockdown' recession wasn't really a recession."
Analyst:
"Okay, geezer."
Many things that seem extraordinary about the past decade will not survive the test of time. We think inflation and a rising cost of capital will separate the authentic from the fraudulent; investment reality from investment illusion. The laws of gravity still apply. So, too, do Capital Market Theory and the idea that future investment returns are a function of (1) today's yield (or price), and (2) how much risk an investor is willing to take.
So, what does the next decade hold in store for investors? No one knows for sure, but one way we explore this question is to ask what it would take to generate a hypothetical return of 7% above the rate of inflation? The following chart illustrates, with perfect hindsight, the portfolio mix or asset allocation required. Notice how the answer has changed over the decades.
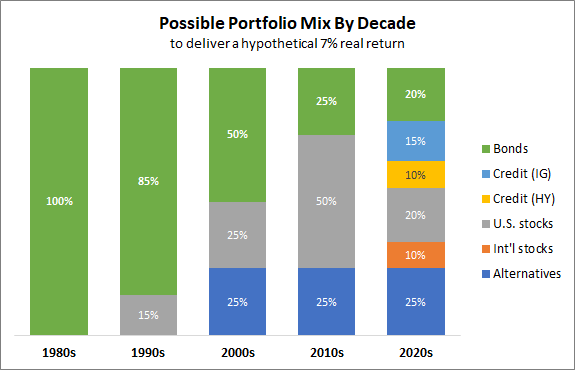
For illustration only. Past performance is no guarantee of future results (see footnote).
During the 1980s, when the 10-year Treasury note yield averaged 10.5%, an all-bond portfolio accomplished the task. As the economy evolved and globalization kicked in, inflation and bond yields fell, requiring investors to seek out and include to the mix different asset classes, including stocks, credit, and alternatives.
One thing to note regarding the 2000s is that, generally, investors were robbed of the chance to achieve a hypothetical real return of 7%. This is because of two economic recessions and market-defining bubbles/crashes (the dot.com bubble and the Global Financial Crisis), which caused stocks to generate a -1% annualized return that decade. Alternatives and bonds saved the day, but the hypothetical mix generated a theoretical real return of 3.5% or roughly half of the 7% investment objective.
So far this decade (2020-2021), stocks and alternatives have generated outsized annualized returns of 23%[2] and 17% [3], respectively. Even against elevated inflation (headline CPI inflation is 5.4%), generally speaking, an investor had to work hard to recently underachieve a 7% hypothetical real return.
Looking ahead, investors are going to be challenged by suppressed yields after two consecutive years of risk asset prices going to the moon. Today's yields have a significant positive relationship with tomorrow's returns. In other words, the lower today’s yield, the lower tomorrow’s return.
Based on current stock and bond yields, our analysis shows the same 2020s asset mix will generate no more than a 2% return after inflation[4]. That is a slim margin of error, in our view.
Against this investment backdrop, RiskBridge is focused on our firm's two competitive strengths: holistic risk management – helping investors identify and quantify all threats to meeting their objectives – and deep alternative manager research and selection.
Specifically, RiskBridge seeks to identify and allocate to those hard-to-find wealth creation and wealth preservation strategies that will help investors navigate an increasingly complex investment landscape and increase their chances of meeting their investment objectives.
To learn more about RiskBridge's investment advisory, guidance, and implementation solutions, email us at info@riskbridgeadvisors.com or give us a call at (203) 658-6055.
---------------------------------------------------------
Footnotes:
[1] A 7% real return is calculated by taking the annualized gross return of the index-weighted portfolio mix and subtracting inflation (U.S. Consumer Price Index (% y/y). The hypothetical 7% real return does not include transaction costs, expenses, fees, or taxes, all of which would reduce actual returns.
[2] S&P 500 Price Index annualized return was 23.4% from 12/31/2019 through 10/29/2021.
[3] HFRI Equity Hedged Total Index annualized return was 17.1% from 12/31/2019 through 10/29/201.
[4] The implied yield for U.S. stocks is estimated at 6.3% based on the Russell 3000 Index’s current dividend yield of 1.23% plus an earnings yield of 5.05%; Assumes a 10yr Treasury yield of 1.50% and CPI of 3.0%.
Source: RiskBridge Advisors, Bloomberg
Bonds - Bloomberg U.S. Aggregate Bond Index
Credit (IG) - Bloomberg U.S. Corporate Total Return Index Value Unhedged
Credit (HY) - Bloomberg U.S. Corporate High Yield Total Return Index Value Unhedged
U.S. Stocks - S&P 500 Price Index
Int'l Stocks - MSCI ACWI - ex U.S. Index
Alternatives - HFRI Fund Weighted Composite Index, HFRI Equity Hedged Total Index, HFRI Macro Total Index, HFRI ED Distressed/Restructuring Index, HFRI Relative Value Total Index; the best performing alternatives segment for each decade was used.
DISCLOSURE:
Past performance is no guarantee of future results. Personnel of RiskBridge Advisors, LLC ("RiskBridge") prepared the Risk Report. The views expressed herein do not constitute research, investment advice, or trade recommendations. RiskBridge may, from time to time, participate or invest in transactions with issuers of securities that participate in the markets referred to herein, perform services for or solicit business from such issuers, and/or have a position or effect transactions in the securities or derivatives thereof.
This Risk Report is distributed for informational purposes only. All material presented is compiled from sources believed to be reliable, but accuracy cannot be guaranteed, and RiskBridge makes no representation as to its accuracy or completeness. Any opinions, recommendations, and assumptions included in this material are based upon current market conditions, reflect the judgment of RiskBridge as of the date indicated, and are subject to change without notice. You acknowledge and agree that RiskBridge is under no obligation to provide any additional information or update such information in making the information available. Securities and/or indices highlighted or discussed in this communication are mentioned for illustrative purposes only and should not be construed as investment recommendations. All investments involve risk, including the loss of principal. Before implementing any strategy, be sure to consult with a qualified financial adviser and/or tax professional. Risk Report and this information are not intended to provide investment, tax, or legal advice, and this material is not to be relied upon in substitution for the exercise of independent judgment. This Risk Report is not to be reproduced, in whole or part, without the written consent of RiskBridge.