
Weekly Risk Radar

Weekly Risk Radar monitors key factors impacting the liquidity, business, and market cycles.
For the week ending January 8, 2021, the S&P 500 Index returned 1.97%, and the Bloomberg Barclays U.S. Aggregate Bond Index returned -0.94%. Year-to-date performance by asset class is shown below.

Top Takeaways
Tail wags dog. According to Goldman Sachs, one of the most remarkable facts in 2020, a year full of incredible facts, is that single stock options trading volume surpassed the underlying stocks' daily trading volume for the first time in history. I remember when options were a derivative form of the stock market. Today, in our opinion, the stock market is a derivative form of the options market. For this reason, we believe the VIX Index has morphed from being a "fear gauge" to being a measure of market liquidity. The fact that the VIX is stuck in a range between 20-30 compared to its long-term average of 18 underscores that market liquidity may not be as fluid as it appears. The study of market structure, including volatility, is critical to effective portfolio construction.
Where's my job? U.S. non-farm payrolls for December were -140,000 compared to expectations of +50,000. November's number was revised up to 336,000 from 245,000. But, in the words of Phillipa Dunne and Doug Henwood at TLR Analytics, "…the road to recovery isn't paved by minus signs." The unemployment rate is steady at 6.7%.
Why did stocks rise and bonds fall on such disappointing economic data? In our opinion, we are at that stage in the recession where bad news is good news. In other words, the worse things get, the more likely significant stimulus will be applied, giving hope for future growth and inflation.
Washington is burning. I find it useful to look to history to help understand what the world witnessed this week. The following comes from the U.S. Senate archives:
April 2, 1917, On rare occasions throughout the Senate's history, frustrated constituents have physically attacked senators. In 1921, a man bearing a grudge about a Nevada land deal entered the Russell Building office of Nevada Senator Charles Henderson. He calmly pulled a pistol, shot the senator in the wrist, and then meekly surrendered. Henderson was not seriously hurt. In 1947, a former Capitol policeman fired a small pistol at his Senate patron, John Bricker, as the Ohio senator boarded a Senate subway car. Neither of the two shots hit Bricker, who had crouched down in the car and ordered the operator to "step on it."
August 24, 1814, as the War of 1812 raged on, invading British troops marched into Washington and set fire to the U.S. Capitol, the President's Mansion, and other local landmarks. The ensuing fire reduced all but one of the capital city's major public buildings to smoking rubble, and only a torrential rainstorm saved the Capitol from complete destruction. Quickly, President James Madison arranged for Congress to meet temporarily at Blodgett's Hotel when it returned to session in September, and the business of Congress continued uninterrupted.
America remains a battlefield.
Cycle analysis
Liquidity cycle (90% of factors are favorable). Global liquidity remains accommodative; however, the global money supply is growing at a six-month rate of change of 8.6% (down from 9.4%), and U.S. commercial bank lending is 12% below its peak set last June. The Federal Reserve Bank's balance sheet ended the year at $7.4 trillion. Based on Fed guidance, Treasury and mortgage securities purchases could raise the Fed's balance sheet to $9.0 trillion (45% of US GDP) by the end of 2021.
Business cycle (47% of factors are favorable). A steeper yield curve, rising bond yields, and outperformance of commodities infer we are in a reflationary economic regime. We look forward to the Conference Board's U.S. Leading Economic Index released on January 28 to see if it can break higher from the current reading of -2.2%.
Market cycle (50% of factors are favorable). The VIX Index is trading at 22 and remains range-bound between 20 and 30. Based on our analysis, lower equity volatility and higher interest rate volatility will be the investment landscape's hallmarks in 2021.
The market sentiment pendulum has swung from fearful to greedy in a week. The CNN Fear & Greed Index is 70 (100 is extreme greed).
Portfolio Positioning
The table below reflects our current asset class preferences as of publication. Asset class views are shown relative to our long-term equilibrium view and reflect prevailing volatility, volume, and valuation conditions. Asset class views may change without notification.

The chart below illustrates the implied risk premia for broad U.S. and non-U.S. equity indices. To calculate the implied risk premia, we apply a five-year dividend discount model (DDM) approach. The risk premia reflect the imputed IRR based on today's market price and a risk- free rate using the prevailing 5-year Treasury note yield.
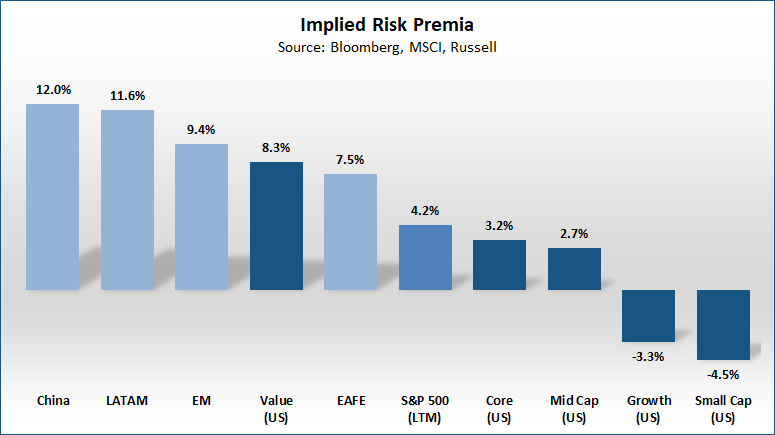
Based on our analysis, non-U.S. equities offer a more attractive forward return than the U.S. This appears to be true even if our growth assumptions were wrong by half. The current implied risk premium for the U.S. of 3.2% is below its long-term average of 4.2%. All else being equal, at what level of S&P 500 would the risk premium revert to its long-term average? 3,650 (-5% below current levels).
Follow on Twitter @risk_report
DISCLOSURE: Past performance is no guarantee of future results. Investment involves risk.
RiskBridge Advisors, LLC ("RiskBridge") is a registered investment adviser located in New Canaan, Connecticut. Such registration does not imply a certain level of skill or training. RiskBridge may only transact business in those states in which it is registered or qualifies for an exemption or exclusion from registration requirements. RiskBridge is limited to disseminating general information about its advisory services, together with access to additional investment-related information, publications, and links. Accordingly, the publication of the Risk Report on the Internet should not be construed by any consumer or prospective client as RiskBridge's solicitation to effect or attempt to effect transactions in securities or the rendering of personalized investment advice for compensation over the Internet. For information about the registration status of RiskBridge, please contact the state securities regulators for those states in which RiskBridge maintains a registration filing. RiskBridge's current written disclosure statements discussing RiskBridge business operations, services, and fees are available at the SEC's investment adviser public information website – www.adviserinfo.sec.gov or from RiskBridge upon written request.
This material is distributed solely for informational purposes only and is not a solicitation or an offer to buy any security or instrument or participate in any trading strategy. All material presented is compiled from sources believed to be reliable, but accuracy cannot be guaranteed, and RiskBridge Advisors, LLC makes no representation as to its accuracy or completeness. Securities highlighted or discussed in this communication are mentioned for illustrative purposes only and are not necessarily recommended for these securities. Any opinions, recommendations, and assumptions included in this presentation are based upon current market conditions, reflect our judgment as of the date of this presentation, and are subject to change. All investments involve risk, including the loss of principal. Be sure to first consult with a qualified financial adviser and/or tax professional before implementing any strategy. Risk Report and this information are not intended to provide investment, tax, or legal advice.
Benchmarks and indices are presented herein for illustrative and comparative purposes only. Such benchmarks and indices may not be available for direct investment, may be unmanaged, assume reinvestment of income, do not reflect the impact of any trading commissions and costs, management or performance fees, and have limitations when used for comparison or other purposes because they, among other things, may have different strategies, volatility, credit, or other material characteristics (such as limitations on the number and types of securities or instruments) than RiskBridge account. It should not be assumed that your account performance or the volatility of any securities held in your account will correspond directly to any comparative benchmark or index. We make no representations that any benchmark or index is an appropriate measure for comparison. Please see below for brief descriptions of some of the major indices mentioned in this material:
The S&P 500® Index is a market capitalization-weighted index of 500 of the largest U.S. companies, designed to measure broad U.S. equity performance.
The Bloomberg Barclays U.S. Aggregate Bond Index is a broad-based market capitalization-weighted bond market index representing intermediate-term investment-grade bonds traded in the United States.
The Core Personal Consumption Expenditure Price Index Excluding Food and Energy, also known as the core PCE price index, is a measure of prices paid for goods and services in the U.S. Core PCE is the Fed's preferred inflation measure.