
Cycle Update
Cycle Update
Market Overview
The global economic recovery has been uneven. This is evident in the year-to-date change in 10-year government bond yields, including the U.S. (+51 bps), Germany (+34 bps), Japan (+2 bps), and China (-6 bps). Further signs of an uneven recovery are found in USD-based equity market returns for the U.S. (+18%), Europe (+12%), Japan (+2%), and China (+1%).
In the case of the U.S., economic activity and inflation accelerated in the first half. The "fast forward" economic recovery was driven by post-pandemic reopening and aggressive fiscal and monetary stimulus.
We argued in March that consensus estimates for GDP growth and corporate earnings were too low. That is no longer the case in our view. Economists and analysts raced to upgrade their forecasts. Today, the consensus forecast for 2021 real U.S. GDP growth is 6.6%. The consensus estimate for S&P 500 earnings is $190/share.
Against this macro backdrop, investors rushed into risk assets. According to Bank of America, total equity market inflows in 2021 are on pace to reach $1.2 trillion, which would surpass the cumulative total inflows of the previous 12 years.
The National Bureau of Economic Research's Business Cycle Dating Committee should soon announce the end of the 2020 recession, just as U.S. stocks are hitting new all-time highs. We now see very little room for further upward revisions, and we wonder if everyone's crowded on the same side of the stock market boat.
Cycle Analysis
Liquidity Cycle
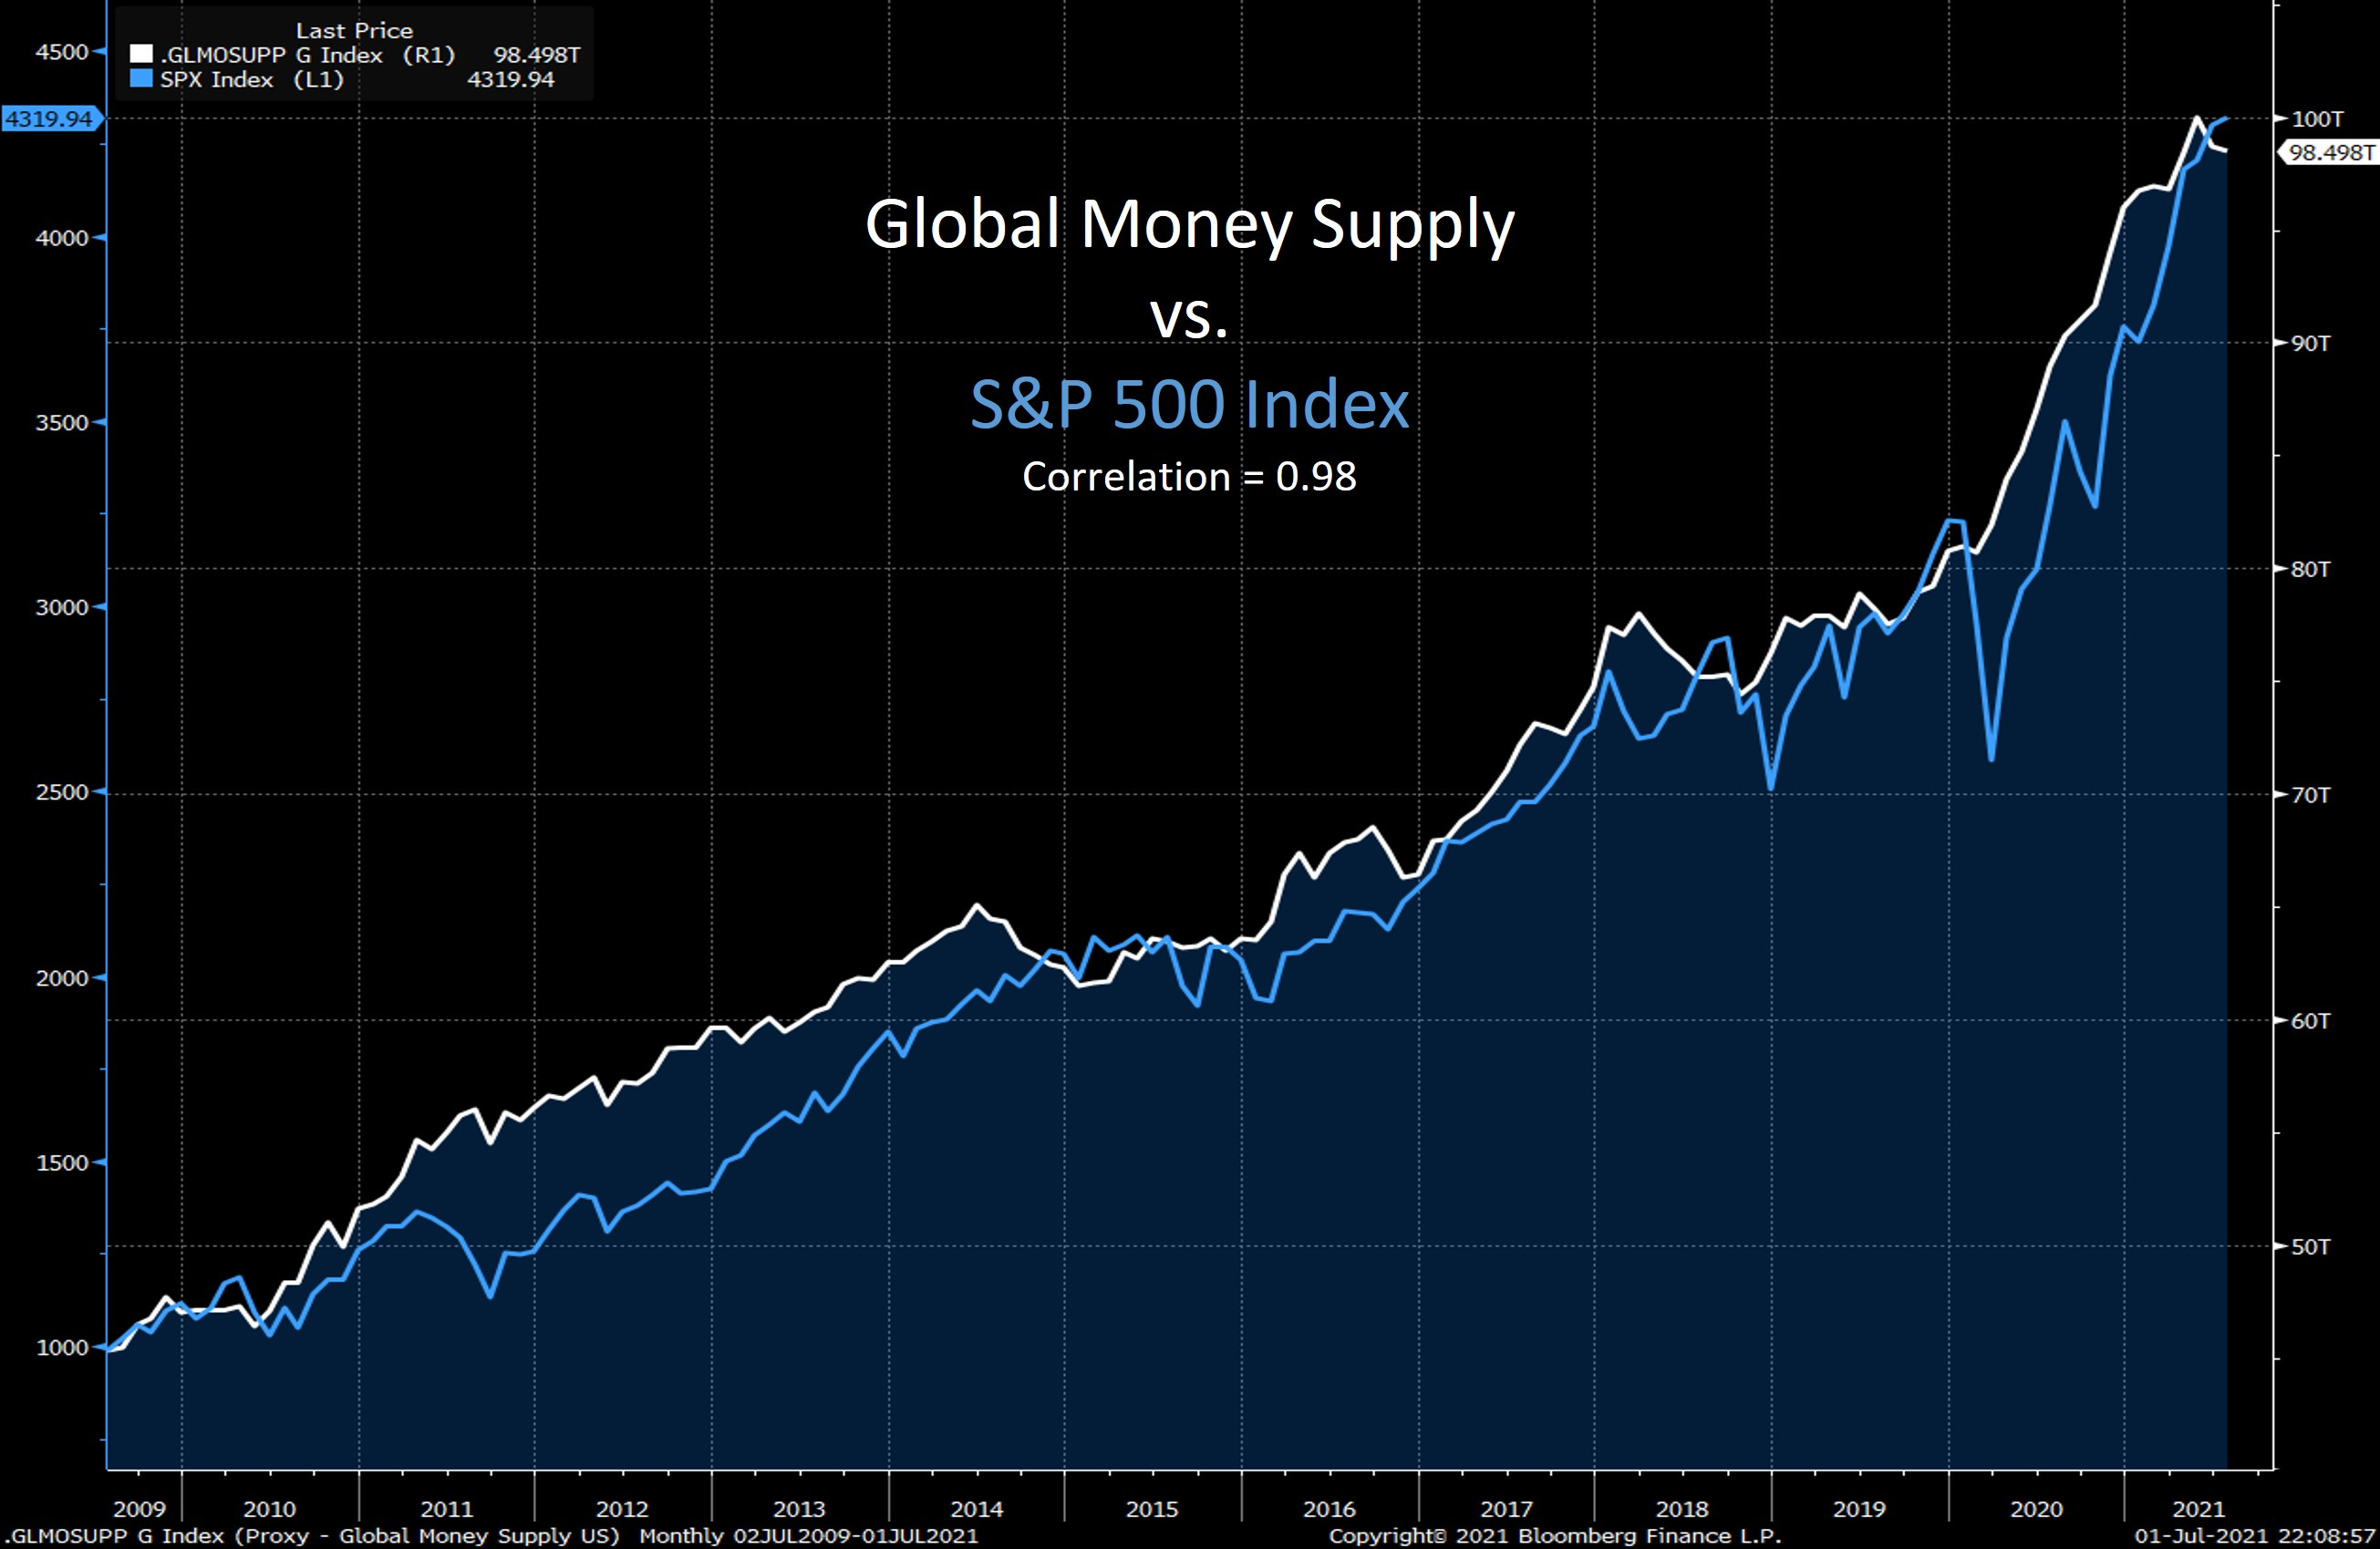
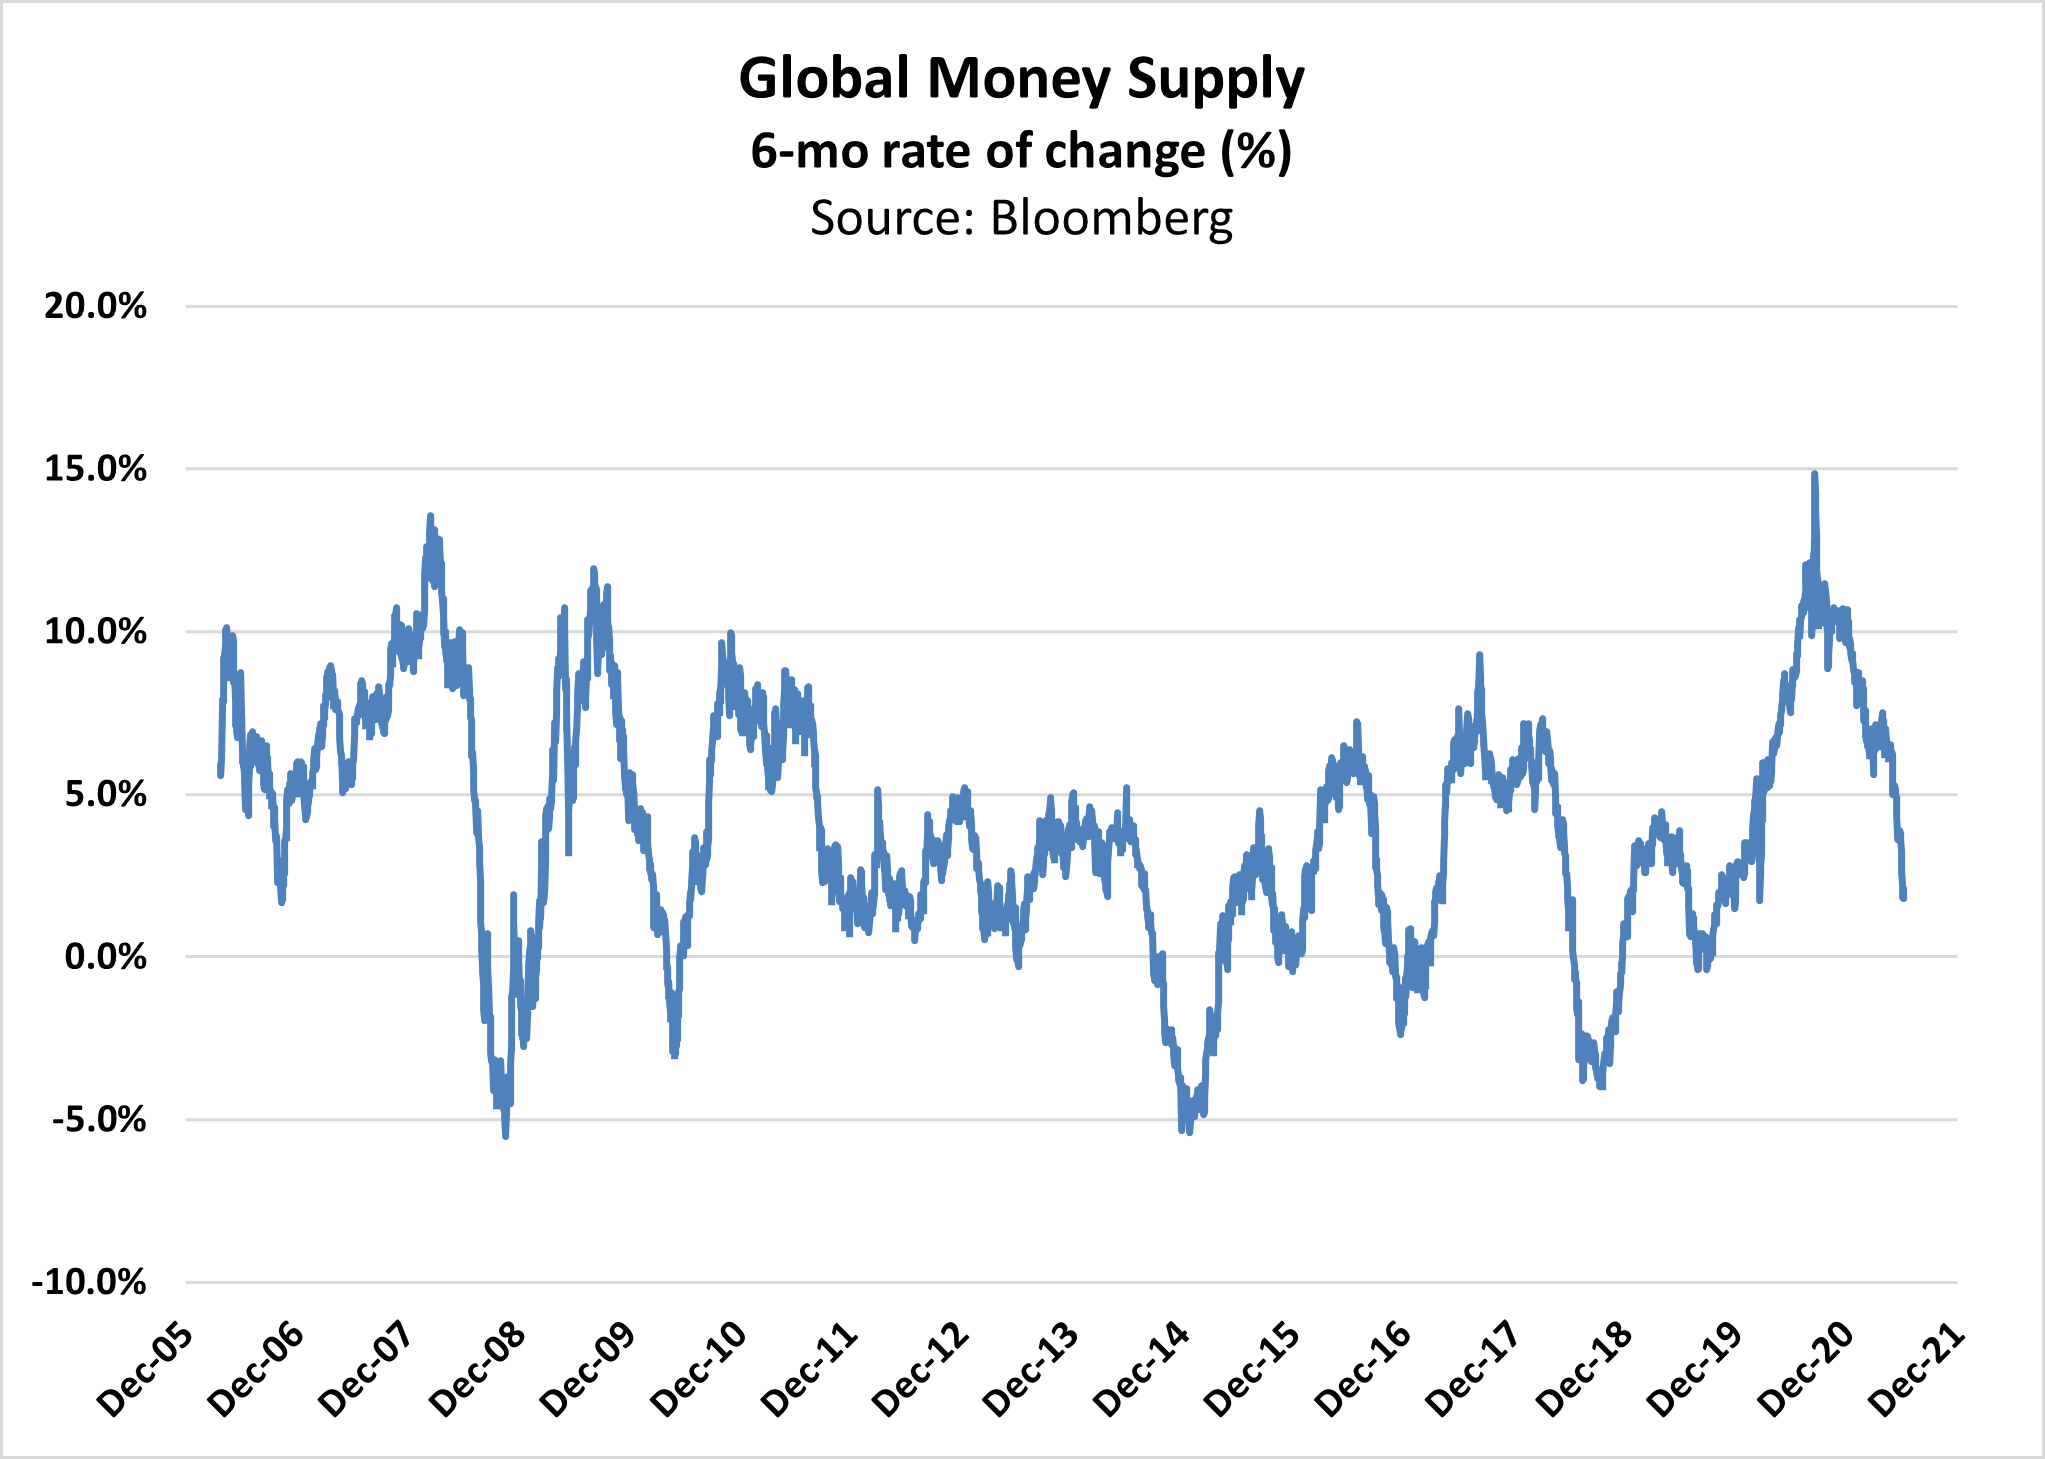
Of our three cycle models (liquidity, business, market), the liquidity risk indicators have deteriorated the most since March. The global money supply growth is slowing to only 2.5% on a 6-month basis, and the U.S. money supply (M2) has decelerated to 13% y/y from 27% y/y. We expect the Fed to announce plans to reduce purchases of Treasurys and MBS, which would be a net negative for liquidity. Changes in liquidity conditions matter due to their high correlation to stock market price changes.
Business Cycle
Growing consumer activity and post-COVID mobility are ushering in a rise in nominal GDP growth and recent inflation spikes. 67% of our growth indicators and 60% of our inflation indicators are accelerating.
Supply-side constraints are pushing inflation higher. This is evidenced in the 5% y/y headline consumer price inflation (CPI) and the 3.4% core personal consumption expenditures (PCE), the Fed's preferred measure of inflation.
The recent spike in inflation has come from goods and services closely related to the post-pandemic transition, including used cars, hotels, car rentals, and airfare. These components account for only 6% of core CPI. Investors should watch for pricing pressures in rent, "owners' equivalent rent," and healthcare, which account for nearly half of CPI, to determine inflation's durability.
Supply constraints exist in the labor market, too. The U.S. has regained 11 million of the 17 million full-time jobs lost during the pandemic, leaving a shortfall of 6 million jobs. The sub-par job market is reflected in decelerating retail sales data, and the Conference Board's Consumer Confidence indicator still below pre-pandemic levels.
Market Cycle
Three of our five risk proprietary trend models are flashing "risk-on." Our two currency models (USD, AUD/JPY) models signal caution. One explanation for recent USD strength is that U.S. corporations are repatriating overseas profits in advance of new corporate tax law changes later this year. If this is the case, then the dollar may resume its weakening trend later this year.
Since March, the yield curve flattened from 143 bps to 84 bps, and 10-year Treasury yields declined 1.74% to 1.42%. Conversely, the price of Brent crude oil rose from $63.54 to $76.17. It's rare to see such a wide divergence between macro indicators. We suspect someone may be wrong.
The VIX Index is trading at 15, well below the "danger zone." Our financial turbulence indicator is signaling "quiet." Investor sentiment is neither too fearful nor too greedy, with the CNN Fear & Greed Index at 45.
RiskBridge will continue to assess the environment, which will dictate future tactical tilts to client portfolios.
DISCLOSURE:
Past performance is no guarantee of future results. This Risk Report has been prepared by personnel of RiskBridge Advisors, LLC (“RiskBridge”). The views expressed herein do not constitute research, investment advice, or trade recommendations. RiskBridge may, from time to time, participate or invest in transactions with issuers of securities that participate in the markets referred to herein, perform services for or solicit business from such issuers, and/or have a position or effect transactions in the securities or derivatives thereof.
This Risk Report is distributed for informational purposes only. All material presented is compiled from sources believed to be reliable, but accuracy cannot be guaranteed, and RiskBridge makes no representation as to its accuracy or completeness. Any opinions, recommendations, and assumptions included in this material are based upon current market conditions, reflect the judgment of RiskBridge as of the date indicated, and are subject to change without notice. You acknowledge and agree that in making the information available, RiskBridge is under no obligation to provide any additional information or to update such information. Securities and/or indices highlighted or discussed in this communication are mentioned for illustrative purposes only and should not be construed as investment recommendations. All investments involve risk, including the loss of principal. Be sure to first consult with a qualified financial adviser and/or tax professional before implementing any strategy. Risk Report and this information are not intended to provide investment, tax, or legal advice, and this material is not to be relied upon in substitution for the exercise of independent judgment. This Risk Report is not to be reproduced, in whole or part, without the written consent of RiskBridge.